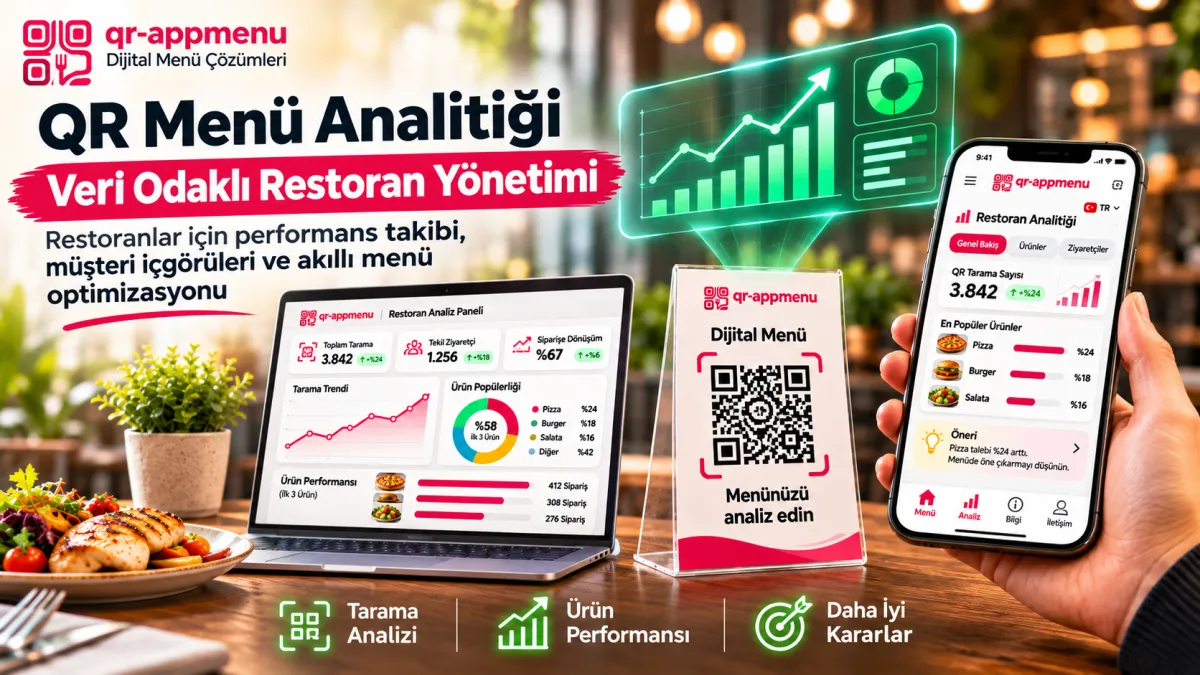
What Is QR Menu Analytics? Measurement Limits and Restaurant UX Tests
Opening a digital menu does not show which dish a visitor purchased. When discussing QR analytics, keep menu views, interactions, and transactions separate. QR AppMenu's confirmed product sheet does not list advanced sales analytics or POS integration. This article describes how restaurants can evaluate measurement needs; it does not claim that specific reporting dashboards exist in QR AppMenu.
What can be measured?
With appropriate instrumentation, a platform may record page opens, category interactions, filter selections, or language changes. If the application does not record an event, there is no corresponding report. Repeated page opens are not equivalent to unique guests or occupied tables.
Menu analytics versus POS sales
A POS records completed transactions. Looking at a menu item does not establish a purchase. A claim such as “many views but few sales” requires reliable links between view data and sales for the same period. Do not assume QR AppMenu provides that connection.
A usability experiment without analytics
If a café suspects that guests cannot find hot drinks, ask five people to locate the price of a specific beverage. Observe which categories they choose, where they hesitate, and which labels confuse them. Simplify category names and repeat the task. This is usability evidence, not proof of increased revenue.
QR AppMenu's visible menu tools
The advertised product experience includes photo galleries, favorites, label and allergen filters, language selection, and theme switching. It does not follow that all those actions are collected as analytics events. A restaurant that needs reporting should confirm the actual capture and dashboard scope before relying on it.
Privacy and interpretation
Avoid collecting unnecessary personal information. If tracking is implemented, define captured events, retention, and access. Seasonal and device differences can confound interpretation; one number cannot conclusively measure satisfaction or staff performance.
Five questions before measuring
- Which business decision are we trying to improve?
- Is the required event actually recorded?
- Can repeated scans and staff tests be distinguished?
- If sales are linked, who verifies the data?
- Could a small user test provide useful evidence without tracking?
A measurement glossary: what does each number really mean?
“100 scans = 100 customers” is not a sound inference. One person may reopen the menu repeatedly, a guest may browse for a group, and visits may include testing or automated traffic. Likewise, an item view is not proof of a sale. Transaction figures must come from separate reliable POS or order records. Do not claim QR AppMenu offers advanced sales attribution or POS conversion tracking without verification.
| Event | What it supports | What it does not prove |
|---|---|---|
| Menu view | A menu page was opened | Count of unique guests |
| Item detail | An item page was opened | A purchase happened |
| Saved favorite | An item was saved | An order was sent |
| POS transaction | A sale was recorded | Which menu view caused it |
Learn from guest experience without analytics software
Ask serving staff to note recurring questions such as “Where is the language switch?”, “Where is the price?”, and “Does this contain dairy?” without collecting guest identities. Group the observations weekly, change one explanation or interface element, and review subsequent feedback. Do not treat an observational change as proven sales causation. This simple practice can improve clarity without assuming advanced analytics features.
Conclusion
Digital menu data may be useful, but only events that are actually measured can support claims. Treat QR AppMenu as a menu presentation product, not an assumed sales analytics platform, and validate each reporting requirement against the product itself.
Frequently Asked Questions
What is the main difference between QR menu analytics and POS sales reports?
How does guest browsing time on a QR menu affect sales?
How can peak scan hour data be used in restaurant operations?
What should be done for menu items with high views but low sales?
Which analytics metrics can be tracked in the QR AppMenu dashboard?
Related Posts